
Debugging
The Usage tab shows how the server's tools have been called from the app: calls and failures per tool as bars, with the median and p95 time and when each was last used (also testpion history mcp-tools and the mcp_tool_usage MCP tool).
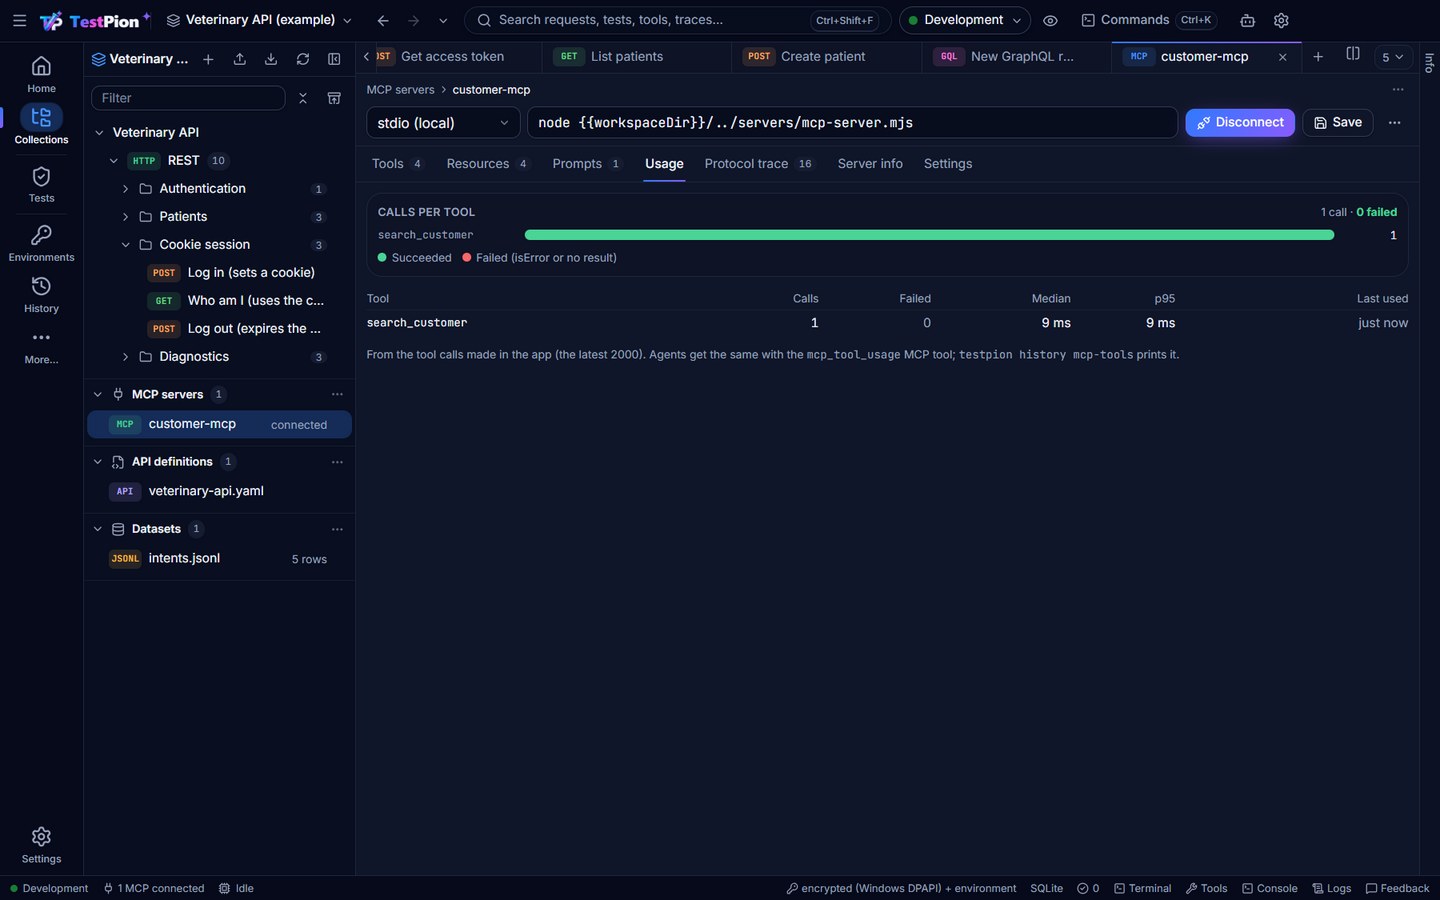
The Protocol trace records every event with:
- timestamp and direction (outgoing, incoming, local lifecycle)
- JSON-RPC method, id and kind (request / response / notification / error / stderr)
- request params and response result or error
- latency, measured by pairing each response with its request
Connection failures show a normalised explanation and suggestions, for example that the process exited before initialize or that stdout contains non-JSON output. Traces are redacted before display or storage.